
Disk IO errors (input/output) issues are a common cause of poor performance on web hosting servers. Hard drives have speed limits, and if software tries to read or write too much data too quickly, applications and users are forced to wait. To put it another way, storage devices can be a bottleneck that stops the server from reaching its full performance potential.
Disk IO is not the only cause of slow servers, so in this article, we’ll explain how to use Linux IO stats to identify disk IO issues and how to diagnose and fix servers with storage bottlenecks.
What Are the Symptoms of Disk IO Errors?
Because disk IO is so important to server performance, it can manifest in many different ways:
- Increased website latency: sites hosted on the server take longer to load than expected.
- High server load: excessive IO can cause other components, including the CPU, to work harder. You can learn more about measuring server load in Troubleshooting High Server Loads.
- You receive a chkservd notification: cPanel & WHM’s built-in chkservd monitoring tool will alert you if a service is unavailable.
- Slow email delivery and webmail interfaces: Email software needs to read data from and write data to the hard drives.
- Slow cPanel & WHM interfaces: Many cPanel & WHM features rely on fast hard drive or database access.
If you observe any of these, high IO loads might be the culprit, but how do you know it’s a storage bottleneck rather than a problem with the network or processor?
Is Disk IO the Cause of Poor Performance?
From the user’s perspective, an IO bottleneck might look just like network latency, among other problems. It’s prudent to make sure that the server’s storage is the real culprit so we don’t waste time and money fixing the wrong problem.
We’ll need to use diagnostic tools on the server’s command line, so log in with SSH.
First, let’s see if the CPU is waiting for disk operations to complete. Type “top” and press enter. This launches the top tool, which shows server statistics and a list of running processes. The wa metric shows IO-wait, the amount of time the CPU spends waiting for IO completion represented as a percentage.
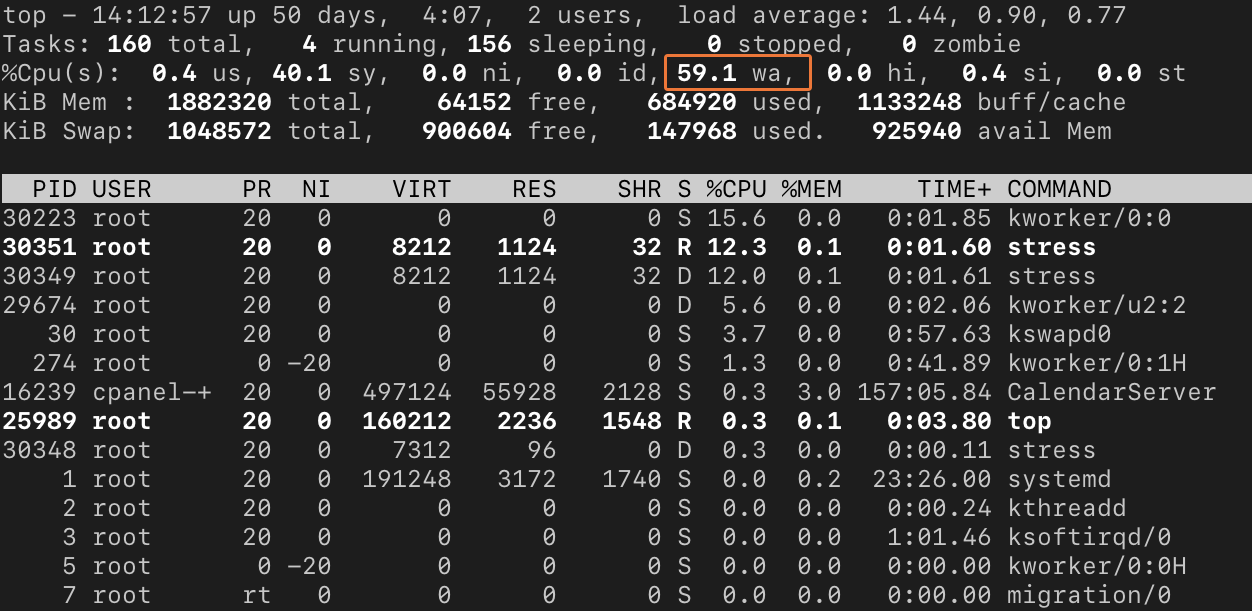
IO-wait is one of a series of processor activity figures in the %CPU row. It also includes:
- us: time spent on user processes.
- sy: time spent on system processes.
- id: idle time.
On the single-CPU server in the example images, these are straightforward to understand. Our server’s CPU spends 59 percent of its time waiting for IO input instead of processing data. An IO-wait above 1 may indicate the server’s hard drives are struggling to supply the processor with data.
On multi-core and multi-processor servers, it’s a little more complex. Because top adds the CPU utilization figures for all cores, they can exceed 100 percent. As a rule, if the IO-wait percentage is bigger than 1 when divided by the number of CPU cores, then the processor must wait before it can process data. For example, on a 4-core system with a wa of 10 percent, the IO-wait is around 2.5, so the processors are forced to wait.
IO-wait times don’t always mean there is an IO bottleneck, but it is a valuable clue, especially when it correlates with observed performance issues. To discover the cause, we need to investigate further with vmstat, which shows statistics for IO, CPU, and memory activity, among others.
vmstat 1 10We’re asking vmstat to show us ten readings at one-second intervals. The first line shows average IO stats since the last reboot, and the subsequent lines show real-time statistics.
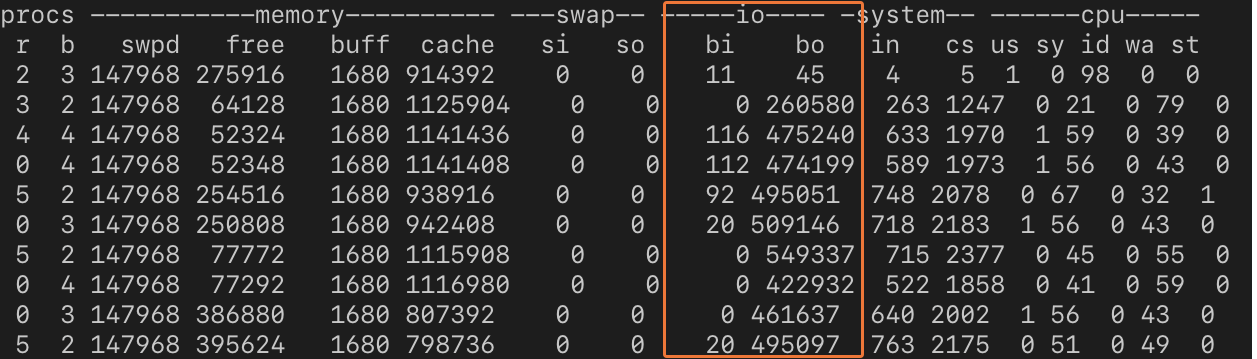
We are interested in the io column, which is divided into input and output. It shows that large amounts of data were written to a storage device throughout the test period. Compared to the average loads in the first row, the IO system is being seriously stressed.
Next, we want to know which hard drive is under load. To find out, we can use iostat.
iostat -mdThe -m option tells iostat to display statistics in megabytes per second, and -d says we’re interested in device utilization.
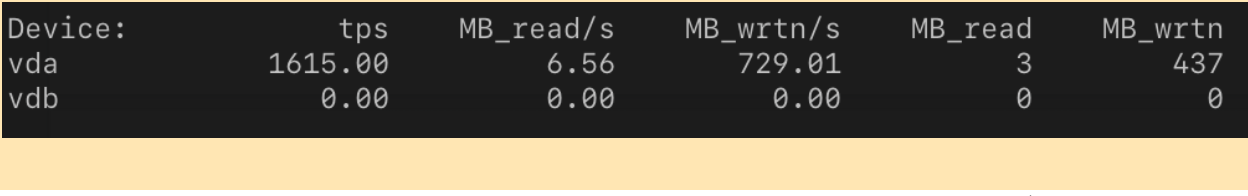
The device called vda is writing 730 MB of data each second. Whether that’s a problem depends on the capabilities of the server and the device, but with the observed performance degradation and large IO wait times, it’s reasonable to conclude that excessive disk IO on vda is the cause of our issues.
There is one other piece of information that could help us narrow things down: the mount point of the vda device. The mount point is the directory on the server’s filesystem the device is connected to. You can find it with the lsblk command.
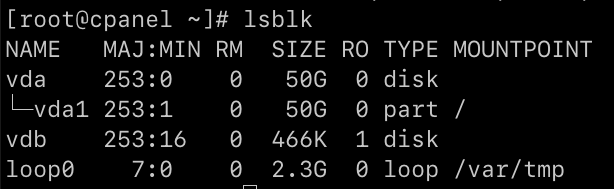
We can see that vda has one partition called vda1 and that it’s mounted on the root of the filesystem (/). On this server, that information is not particularly helpful; it only has one mounted device. However, on a server with several storage devices, lsblk can help you to figure out where the data is being written and which application is writing it.
How To Fix Disk IO Issues
Once you have identified the affected drive, there are several approaches you can take to mitigate disk IO issues.
For example, you may want to try changing a few settings to see if performance improves before you upgrade hard drives or memory. Three hard drive configuration settings you should try changing first are:
1. Turn on write caching
2. Turn on direct memory access
3. Upgrade Server Hardware
Here’s how to do that:
Turn on Write Caching
Write caching collects data for multiple writes in a RAM cache before writing them permanently to the drive. Because it reduces the number of hard drive writes, it can improve performance in some scenarios.
Write caching can cause data loss if the server’s power is cut before the cache is written to the disk. Don’t activate write caching if you want to minimize the risk of data loss.
The hdparm utility can turn write caching on and off. It may not be installed by default on your server, but you can install it from CentOS’s core repository with:
yum install hdparmThe following command turns write caching on:
hdparm -W1 /dev/sdaTo turn write caching off, use:
hdparm -W0 /dev/sdaTurn on Direct Memory Access
Direct Memory Access (DMA) allows the server’s components to access its RAM directly, without going via the CPU. It can significantly increase hard drive performance in some scenarios.
To enable DMA, run the following command, replacing /dev/hda with your hard drive:
hdparm -d1 /dev/hdaYou can turn DMA off with:
hdparm -d0 /dev/hdaDMA isn’t available on all servers and, with virtual servers in particular, you may not be able to modify hard drive settings.
Upgrade Server Hardware
If configuration tweaks don’t solve your IO issues, it’s time to think about upgrading, replacing, or reorganizing the server’s hardware.
- Upgrade the hard drive: If the drive is slow, consider upgrading to a faster spinning disk drive or a solid state drive (SSD) that can better cope with the IO load.
- Split the application load between hard disks: Add hard drives and divide the IO load between them. You may also want to consider giving the operating system’s root filesystem its own drive, so that the operating system and cPanel & WHM don’t have to compete with user applications.
- Increase the server’s memory: If applications can cache more data in RAM, they will not need to read from and write to the filesystem as often. For some applications, an in-memory cache such as Memcached or Varnish may improve performance while reducing disk IO.
- Check the RAID array hardware: A malfunctioning RAID controller can degrade IO performance.
Disk IO bottlenecks can be tricky to diagnose, but the process we’ve outlined here will help you to quickly determine whether you have an IO problem, which drives are affected, and what you can do to improve your server’s performance.
As always, if you have any feedback or comments, please let us know. We are here to help in the best ways we can. You’ll find us on Discord, the cPanel forums, and Reddit.
